Infographic Assignment: Reflecttion
- Nov 4, 2025
- 2 min read
Updated: Nov 7, 2025
Reflection:
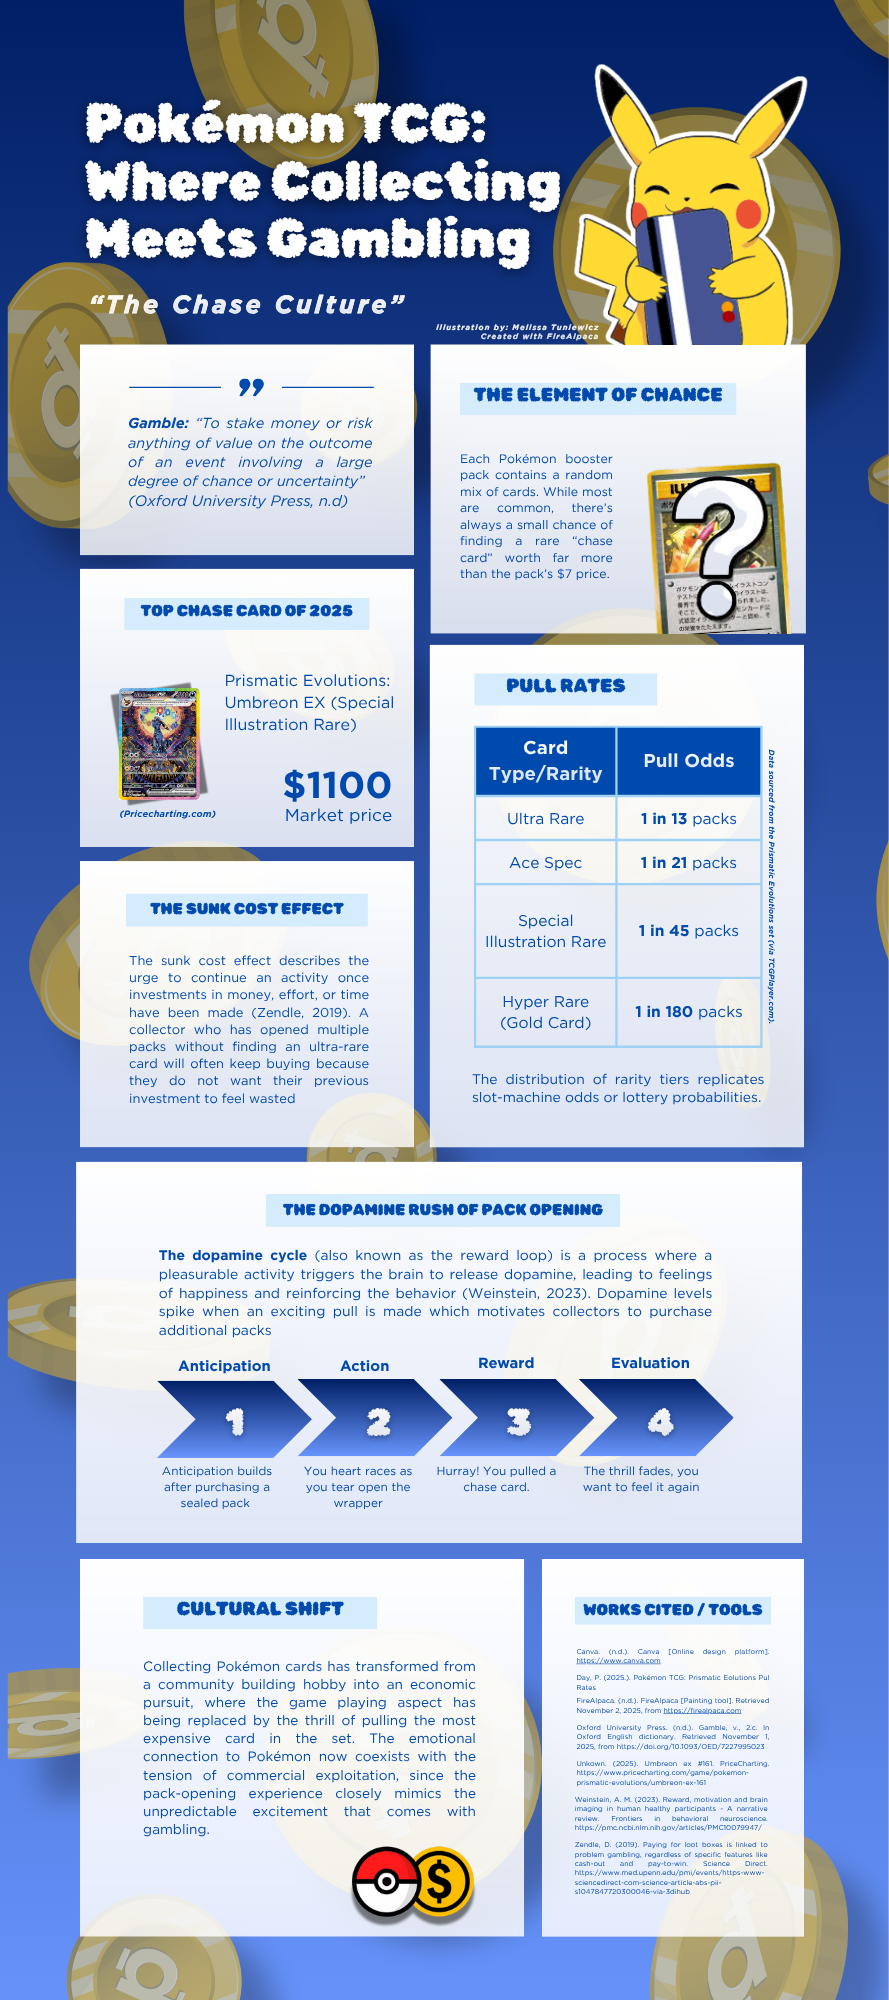
After nearly thirteen years as an avid Pokémon card collector, an unprecedented shift in collector culture has unfortunately priced me out of the hobby as priorities have shifted from gameplay to financial gain. The cost of sealed packs have skyrocketed, which can be attributed to inflated monetary values assigned to sought-after cards within each set. I’ve recently begun to notice the parallels between this phenomenon and gambling culture, and thought it may be interesting to explore these observations further through the creation of an infographic.
After discussing Edward Tufte’s information design principles in class, I initially worried that taking a more artistic approach to my visualization might lessen the effectiveness of my argument. He strongly advocates for visual minimalism and the maximization of the data-to-ink ratio, which seemed quite at odds with my chosen topic revolving around a children’s card game. With this in mind, I decided to balance my creative instincts by incorporating a tasteful amount of visuals rather than filling the design with unnecessary graphics. I used a blue and yellow colour palette consistent with the design of physical Pokémon cards, which would be instantly recognizable to those familiar with the franchise. I also included an illustration of Pikachu holding a credit card to highlight the financial elements of my argument. This infographic is not necessarily geared toward the general public but rather toward those already familiar with the franchise, so I believe both its design and the information I chose to include are well suited to the intended audience.
After creating my own, I have begun to truly appreciate infographics as a medium for conveying information and simplifying nuanced topics in ways that are easy to understand for those who may not have high levels of data literacy. Additionally, this process made me consider how design reflects cultural context, as familiar Pokémon imagery and colors influence how fans and collectors interpret information. As a student who enjoys incorporating creativity into my academic work, I feel that visualizations as a method of learning are no less effective than scholarly articles or research papers.
Works Cited
Canva. (n.d.). Canva [Online design platform]. https://www.canva.com
D’Ignazio, C., & Klein, L. (2020, March 16). 3. on rational, scientific, objective viewpoints from mythical, imaginary, impossible standpoints. Data Feminism. https://data-feminism.mitpress.mit.edu/pub/5evfe9yd/release/5?readingCollection=0cd867ef
Day, P. (n.d.). Pokémon TCG: Prismatic Evolutions Pull Rates. TCGplayer Content. https://www.tcgplayer.com/content/article/Pok%C3%A9mon-TCG-Prismatic-Evolutions-Pull-Rates/d94889ea-f76a-4a13-b74d-5b0b071220a7/?srsltid=AfmBOor9kPcyk-VyKwzTai03tB67qT4OSCjdeT71PRItuCUIX9PFy8S8
FireAlpaca. (n.d.). FireAlpaca [Painting tool]. Retrieved November 2, 2025, from https://firealpaca.com
Oxford University Press. (n.d.). Gamble, v., 2.c. In Oxford English Dictionary. Retrieved November 1, 2025, from https://doi.org/10.1093/OED/7227995023
Unkown. (2025). Umbreon ex #161. PriceCharting. https://www.pricecharting.com/game/pokemon-prismatic-evolutions/umbreon-ex-161
Weinstein, A. M. (2023). Reward, motivation, and brain imaging in healthy human participants: A narrative review. Frontiers in Behavioral Neuroscience. https://pmc.ncbi.nlm.nih.gov/articles/PMC10079947/
Zendle, D. (2019). Paying for loot boxes is linked to problem gambling, regardless of specific features like cash-out and pay-to-win. Science Direct. https://www.sciencedirect.com/science/article/pii/S0747563219302468


Comments